한국 주식 퀀트 백테스트 플랫폼
Build a strategy. Test it like a skeptic.
Combine 376 indicators, backtest on Korean equities since 2016, and let AI flag results that won't hold up.
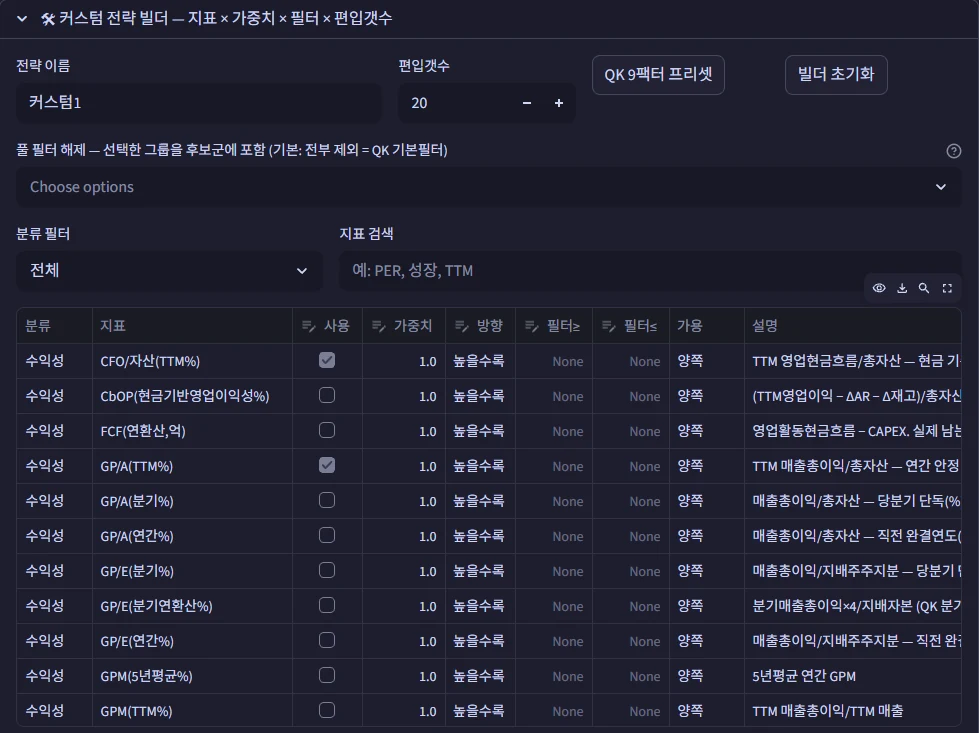
Your rules, your indicators, nearly ten years of history.
Write a strategy the way you think about stocks, then see how it would have behaved across bull runs, crashes and sideways years.
Pick indicators
Search 376 metrics across value, growth, profitability, safety and investor flows.
Weight and filter
Rank by any mix of metrics, or exclude stocks that miss a threshold you set.
Run and compare
Choose 5 to 50 holdings, trading costs and market timing. Compare several strategies side by side.
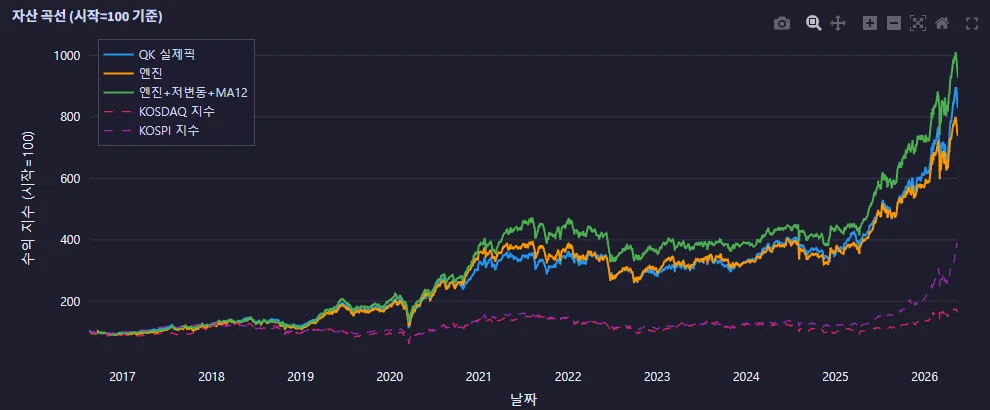
Built so the backtest can't flatter you.
Most backtests look great because of hidden shortcuts. These are the ones we closed.
Delisted companies included
Stocks that went bankrupt or were delisted stay in the history, so results are not inflated by survivors only.
Point-in-time filings
Each rebalance only sees financial reports that were actually filed by that date.
Rejected ideas, on record
Ideas that failed validation are logged with the reason, so they are not quietly retried.
Dual-period check
Every strategy runs on the long historical sample and on recent live data side by side. If it only wins in one, it is flagged as a likely regime bet.
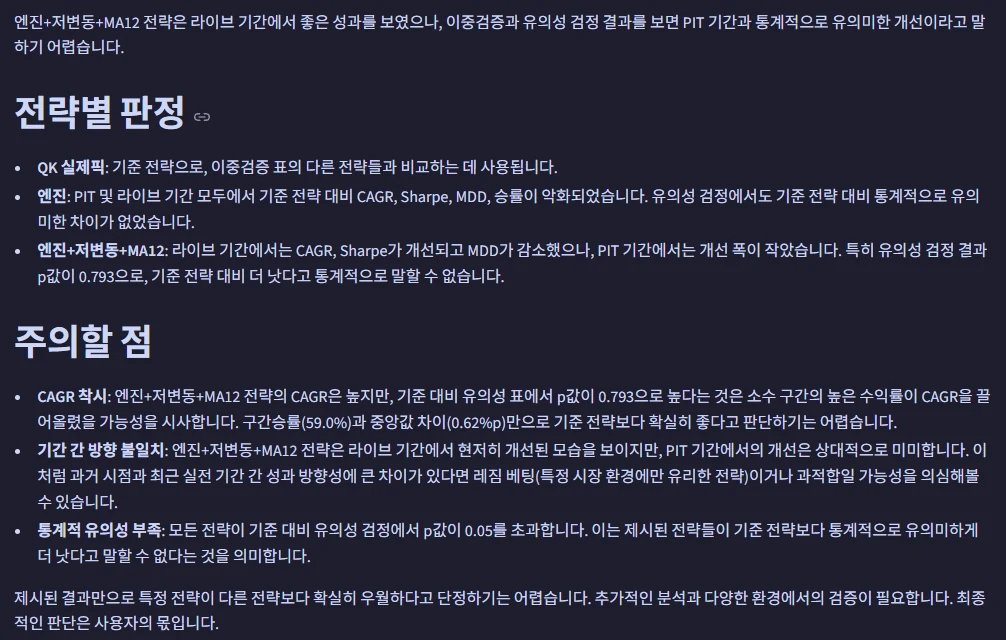
An AI reviewer that reads your results critically.
One click sends the result tables to a large language model with our review rules. It explains, in plain language, whether the edge is real.
Compounding illusions
Is a high annual return backed by consistent wins, or by a few lucky quarters?
Period disagreement
Does the strategy hold up in both the historical and the recent live period?
Luck from trying too many
Checks p-values and warns when the best of many combinations may be chance.
Featured strategy: QK9.
Our in-house strategy, built and stress-tested with the same tools you get. It ranks stocks on nine factors across four families and adds two risk overlays.
Two risk overlays
Kept because they improved both test periods, not just one.
Every factor earns its place
We tested 46 variants that removed factors. Only 2 of them improved recent results.
How it works
Public disclosures and market data become indicators, your rules turn them into portfolios, and every result is reviewed before you trust it.
Six data sources
DART filings, KRX, FinanceDataReader, Naver Finance, FnGuide, KIS
376 indicators
Computed for about 2,600 KOSPI and KOSDAQ stocks
Your strategy
Weights, filters, holdings
Curves and stats
Returns, drawdown, Sharpe, win rate
AI review
Plain-language verdict on what to trust
What we're building next
Describe a strategy in plain words
Type an idea such as "cheap stocks with improving margins" and the AI assembles the indicators, weights and filters for you to review.
Public web beta
The lab runs today as a private research build. A hosted version for early users is next.
Want early access?
Tell us how you invest and what you would test first.